Lab note #054 Visualizing Execution
One of my main goals is to make non-CRUD backend pipelines more visible. I didn't think nodes and wires programming was the way to go, but unconsciously, I envisioned just showing the results of a cell next to the cell, like regular computational notebooks.
But my underlying assumption was that a cell's definition is its only instance. That's incompatible with modeling the cell as a "component." By nature, components are reusable, which means that a cell's definition has more than one instance. If a component's instances are used in different places in a pipeline, how do you show this while executing?
Programming languages typically have two levels, and they go by different names in different aspects of a programming language:
- Types and values
- Classes and object instances
- Schema and data
There are other pairs in other domains, but I'm not aware of a generalized name for this duality. For the lack of a better term, I'll just call it "template" and "instance".
When it comes to a program's semantic meaning, programmers interact with both templates and instances by thinking about types and values or classes and objects. I never thought about it much before, but when it comes to execution, programmers are often only dealing with function definitions, and look at only a small part of function instances. To put it another way when we execute programs, we get pairs of templates and instances also:
- Function definitions and parameterized execution of the function
- React Components and React Fiber
That means when a pipeline is executing, there are two extremes with which we can visualize its execution.
One extreme is to visualize only executing instances, like how React debuggers work. This gives us a clarity of execution by directly showing where execution is happening and easy to trace dynamic flows. But the downside is a detachment from the function definitions which now requires context switching, and there can be redundency in repetition.
On the flipside, the other extreme is to visualize only templates and highlight the template as it's being executed. This directly ties the execution to the edits with minimal visual overhead, but the downside is a loss of instance context. If there are multiple instances of the same active template, it becomes hard to distinguish between them.
Maybe it's procrastination, but the question threw me for a loop. How is this done and is there any prior art? I went through the Visual Programming Codex to see if I could find any examples.
I didn't end up finding it too helpful, though as an aside, I did discover how Blueprint handles abstractions.
I also tried doing some rubber ducking with GPT, which suggested five different options:
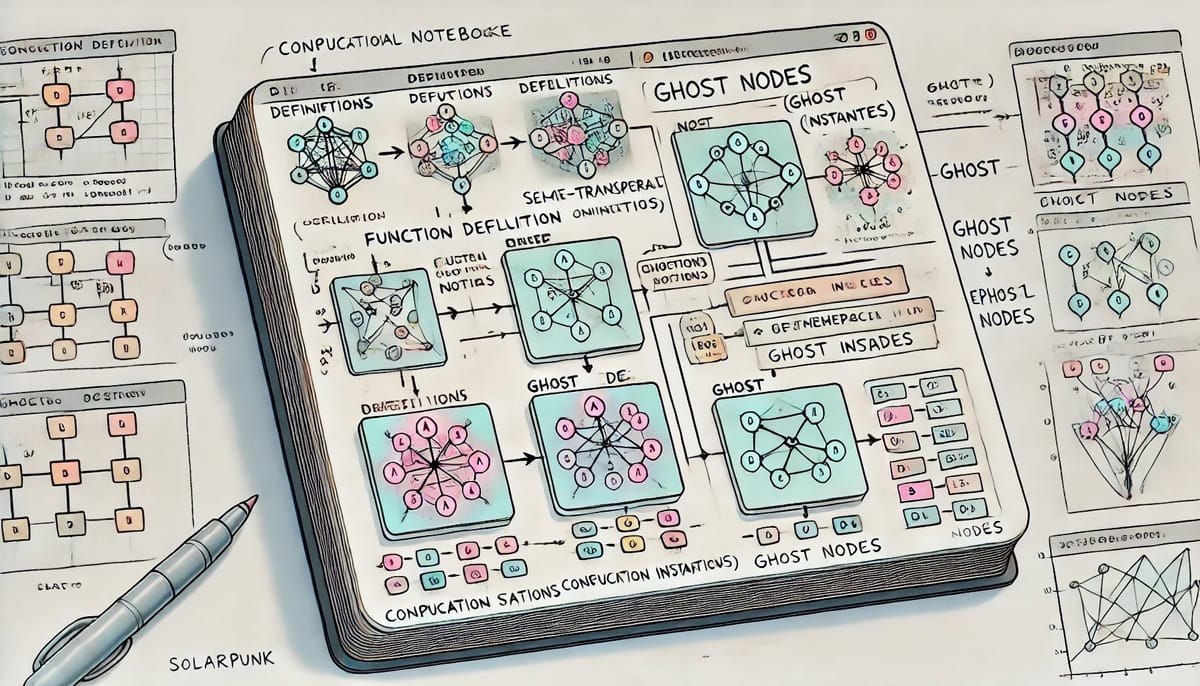
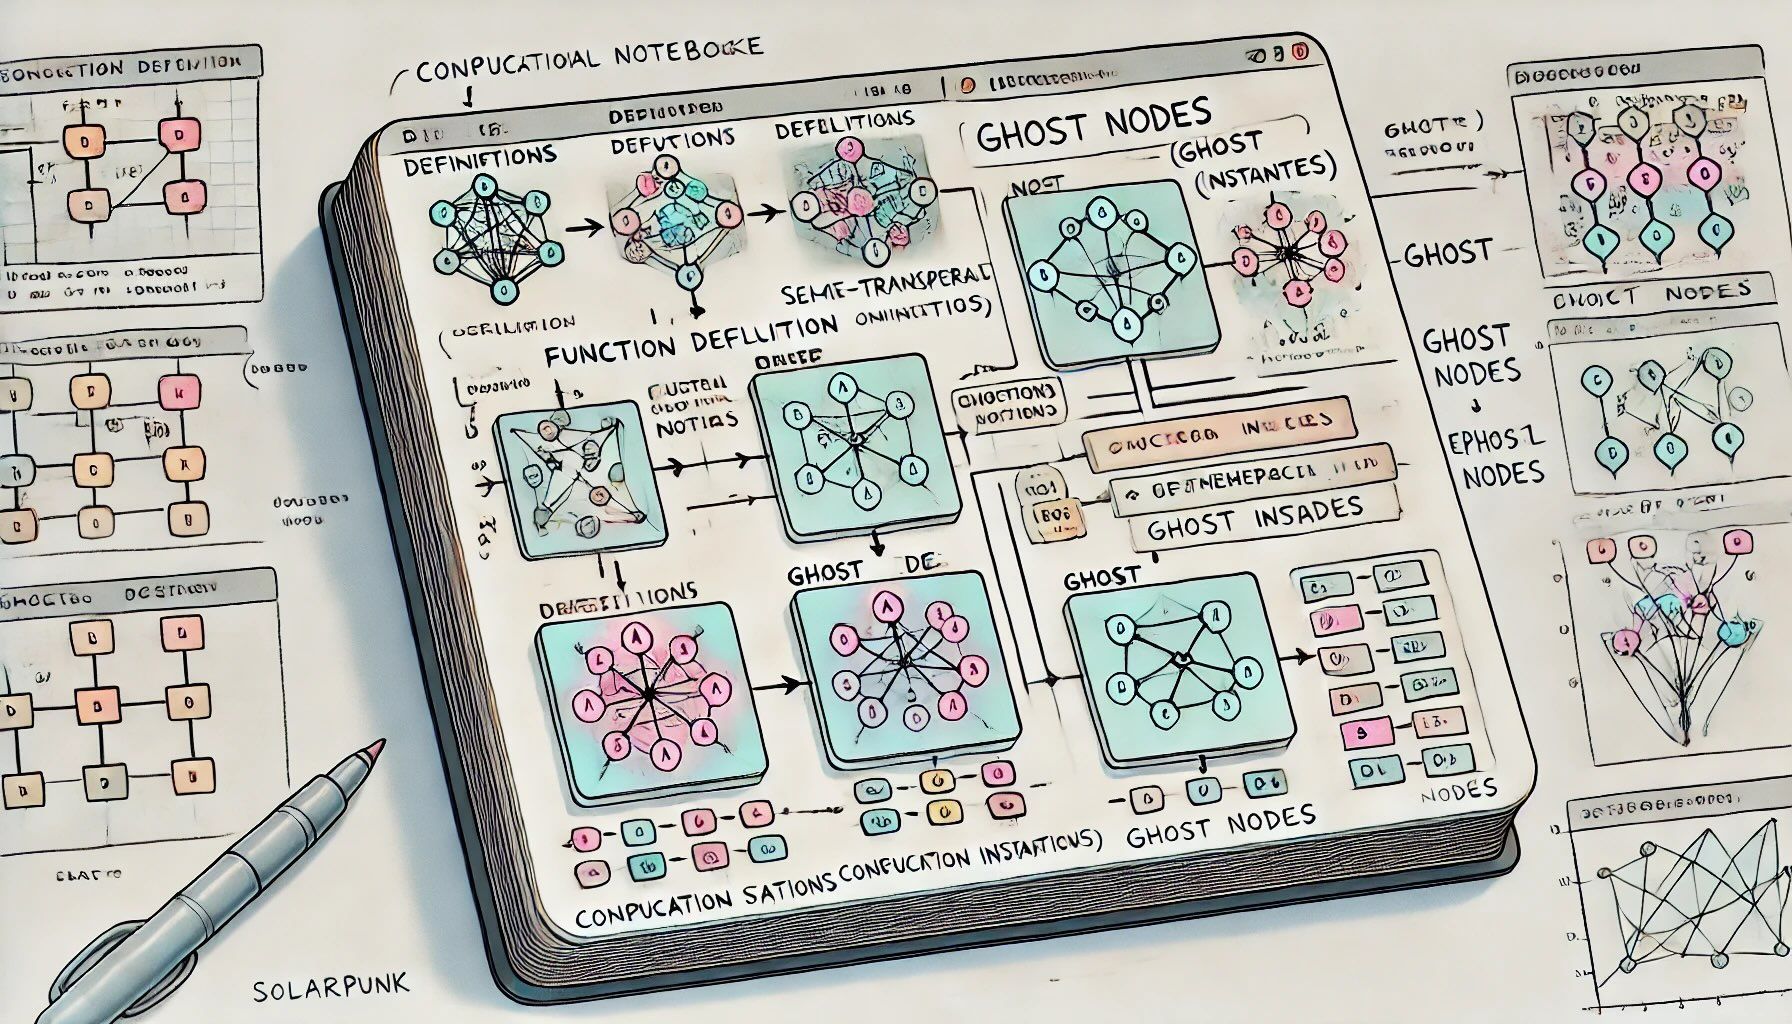
- Overlays and Ghost Nodes
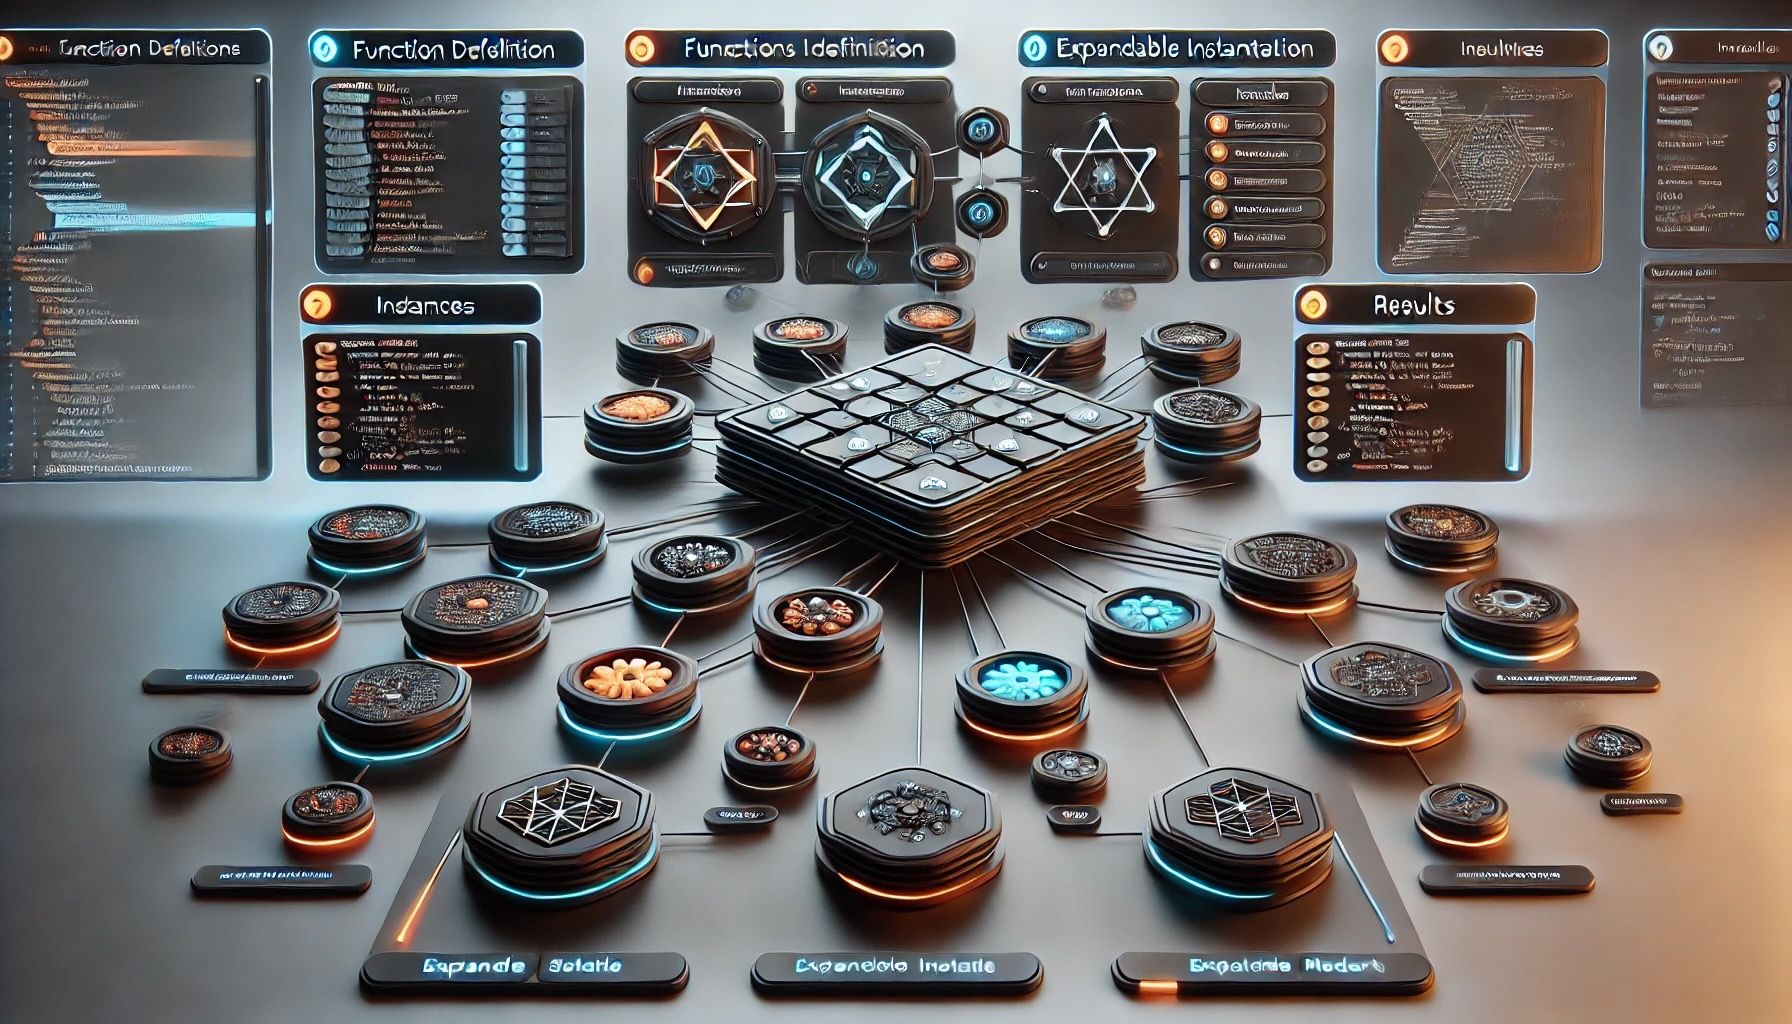
- Expandable Instantiation with Layered Hierarchy
- Instance annotations and Persistent Markers
- In-Situ Proxies for Instances (Local Replication)
- Temporal Slicing of the Computational DAG
Honestly, I couldn't quite picture what it would look like. For fun, I had it generate pictures of each, even though I knew it would be more inspirational than instructive.
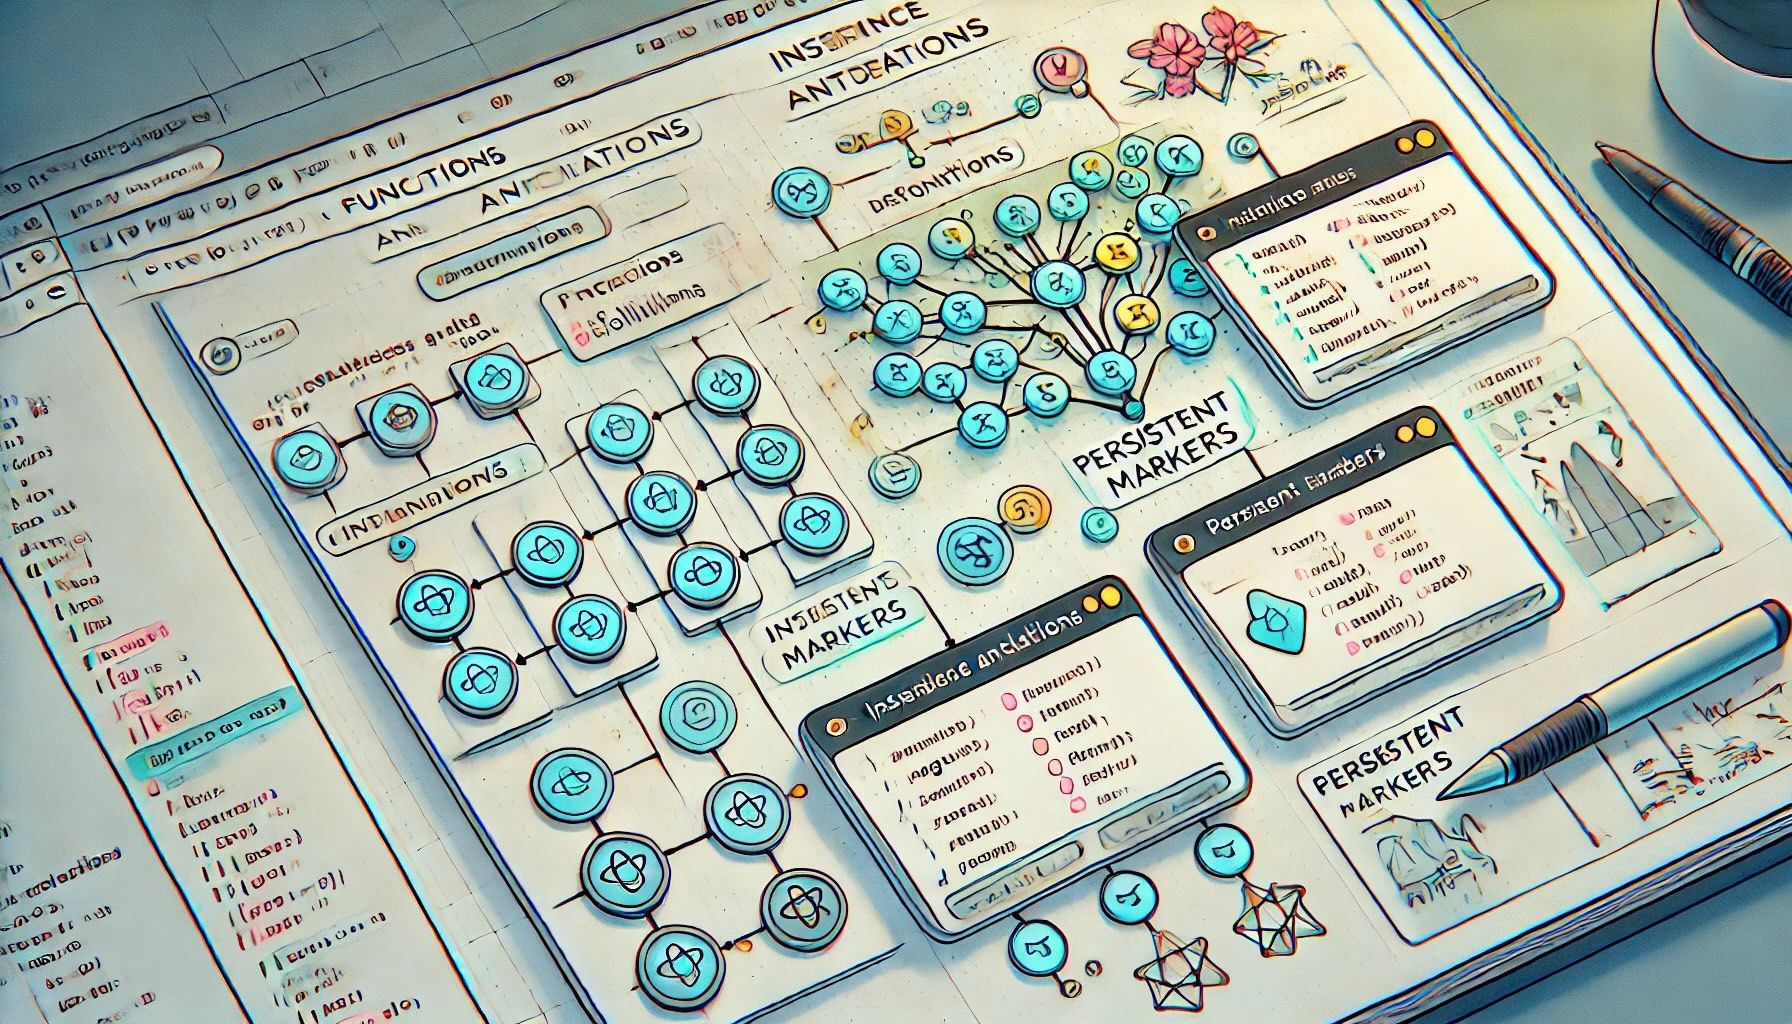
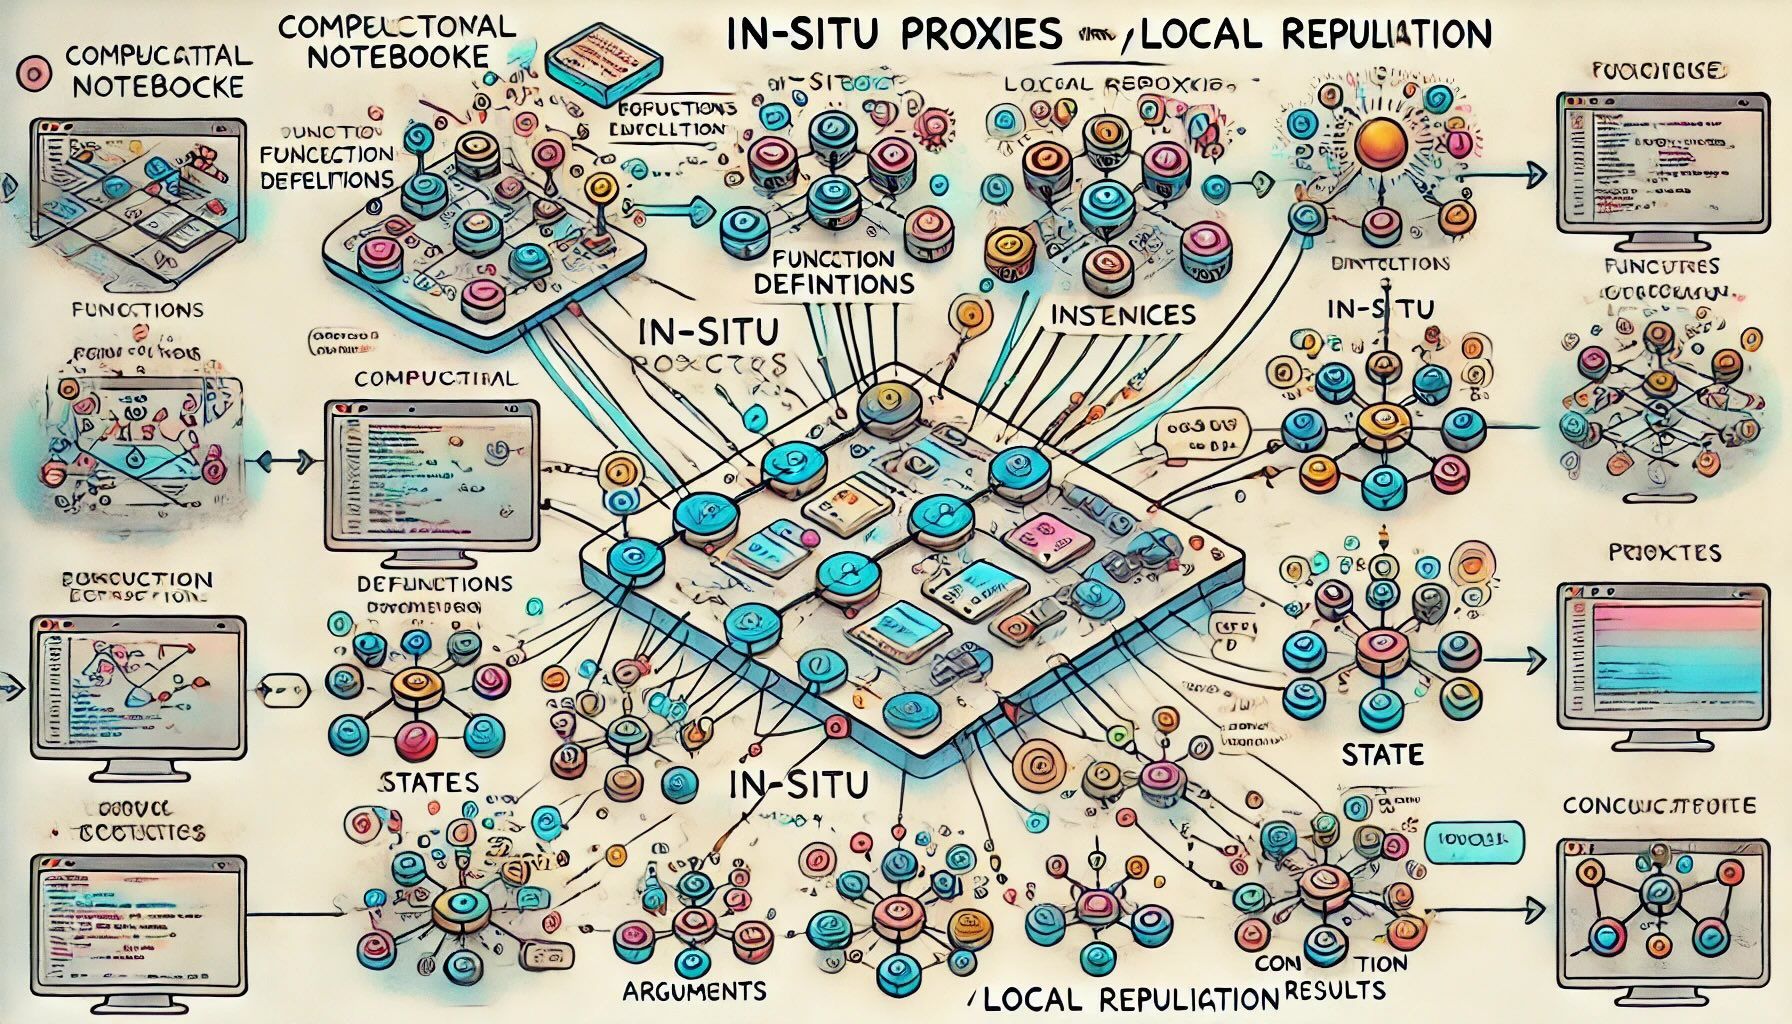
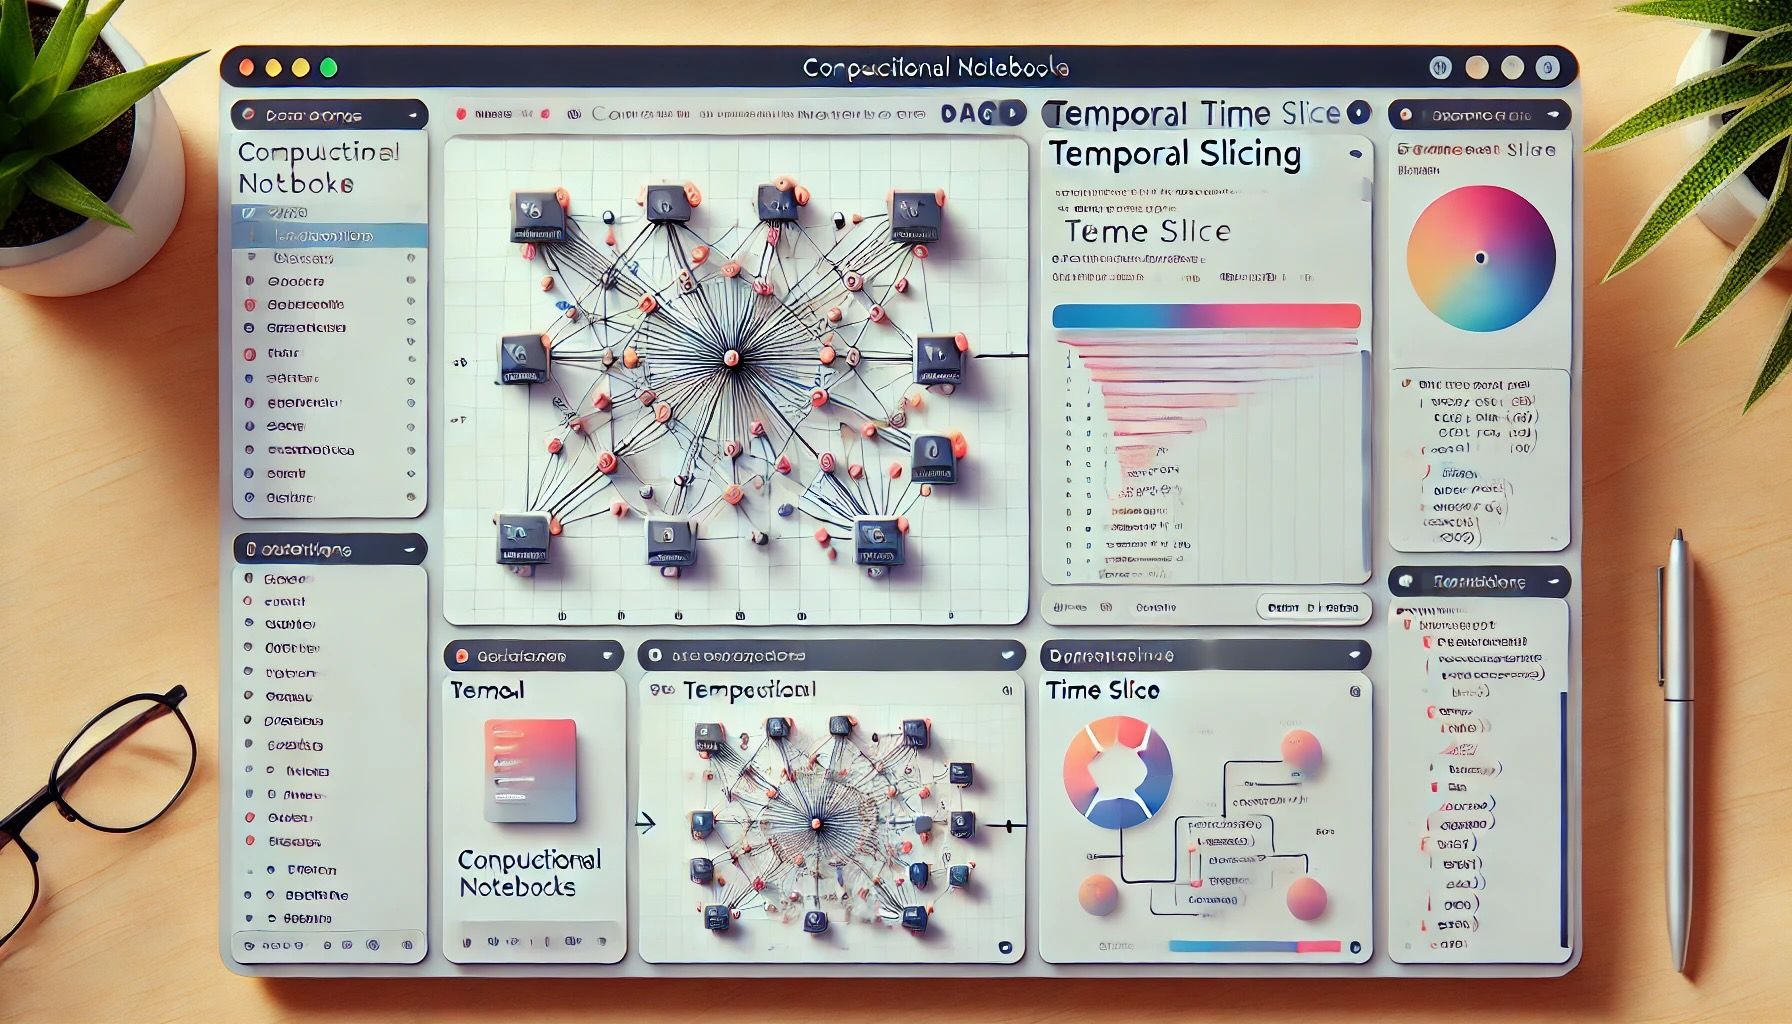
But after chatting with it over and over again at different angles, a couple bullet points triggered some clarity in my mind. It suggested the following:
Dual-Level Representation:
- Templates form the primary, static structure.
- Instances are rendered as ephemeral overlays or as an expandable tree-like view connected to their templates.
Linking Templates to Instances:
- Each template is annotated with indicators showing its active instances (e.g., a counter or list of active instance IDs).
- Clicking an indicator navigates to or expands the instance-level view.
Focused Instance Views:
- Instances are shown in context when needed, such as during execution tracing, debugging, or state inspection.
- This view highlights execution paths and state transitions but fades into the background when not actively debugging.
For some reason, this reminded me of how debuggers are today, except we want a more visual representation of a stack trace and state. Framed in that way, I find it blindingly obvious, and wondered why I was so stuck before.
I think the exact details are still fuzzy, and will need to be worked out by generating options, trying it out, and seeing what works--like what designers do. One interesting method here is to ask the GPT to generate a prototype in React that I can run in codesandbox. The result is honestly not great, but it's at least something to play with that I can use my imagine to take the rest of the way.
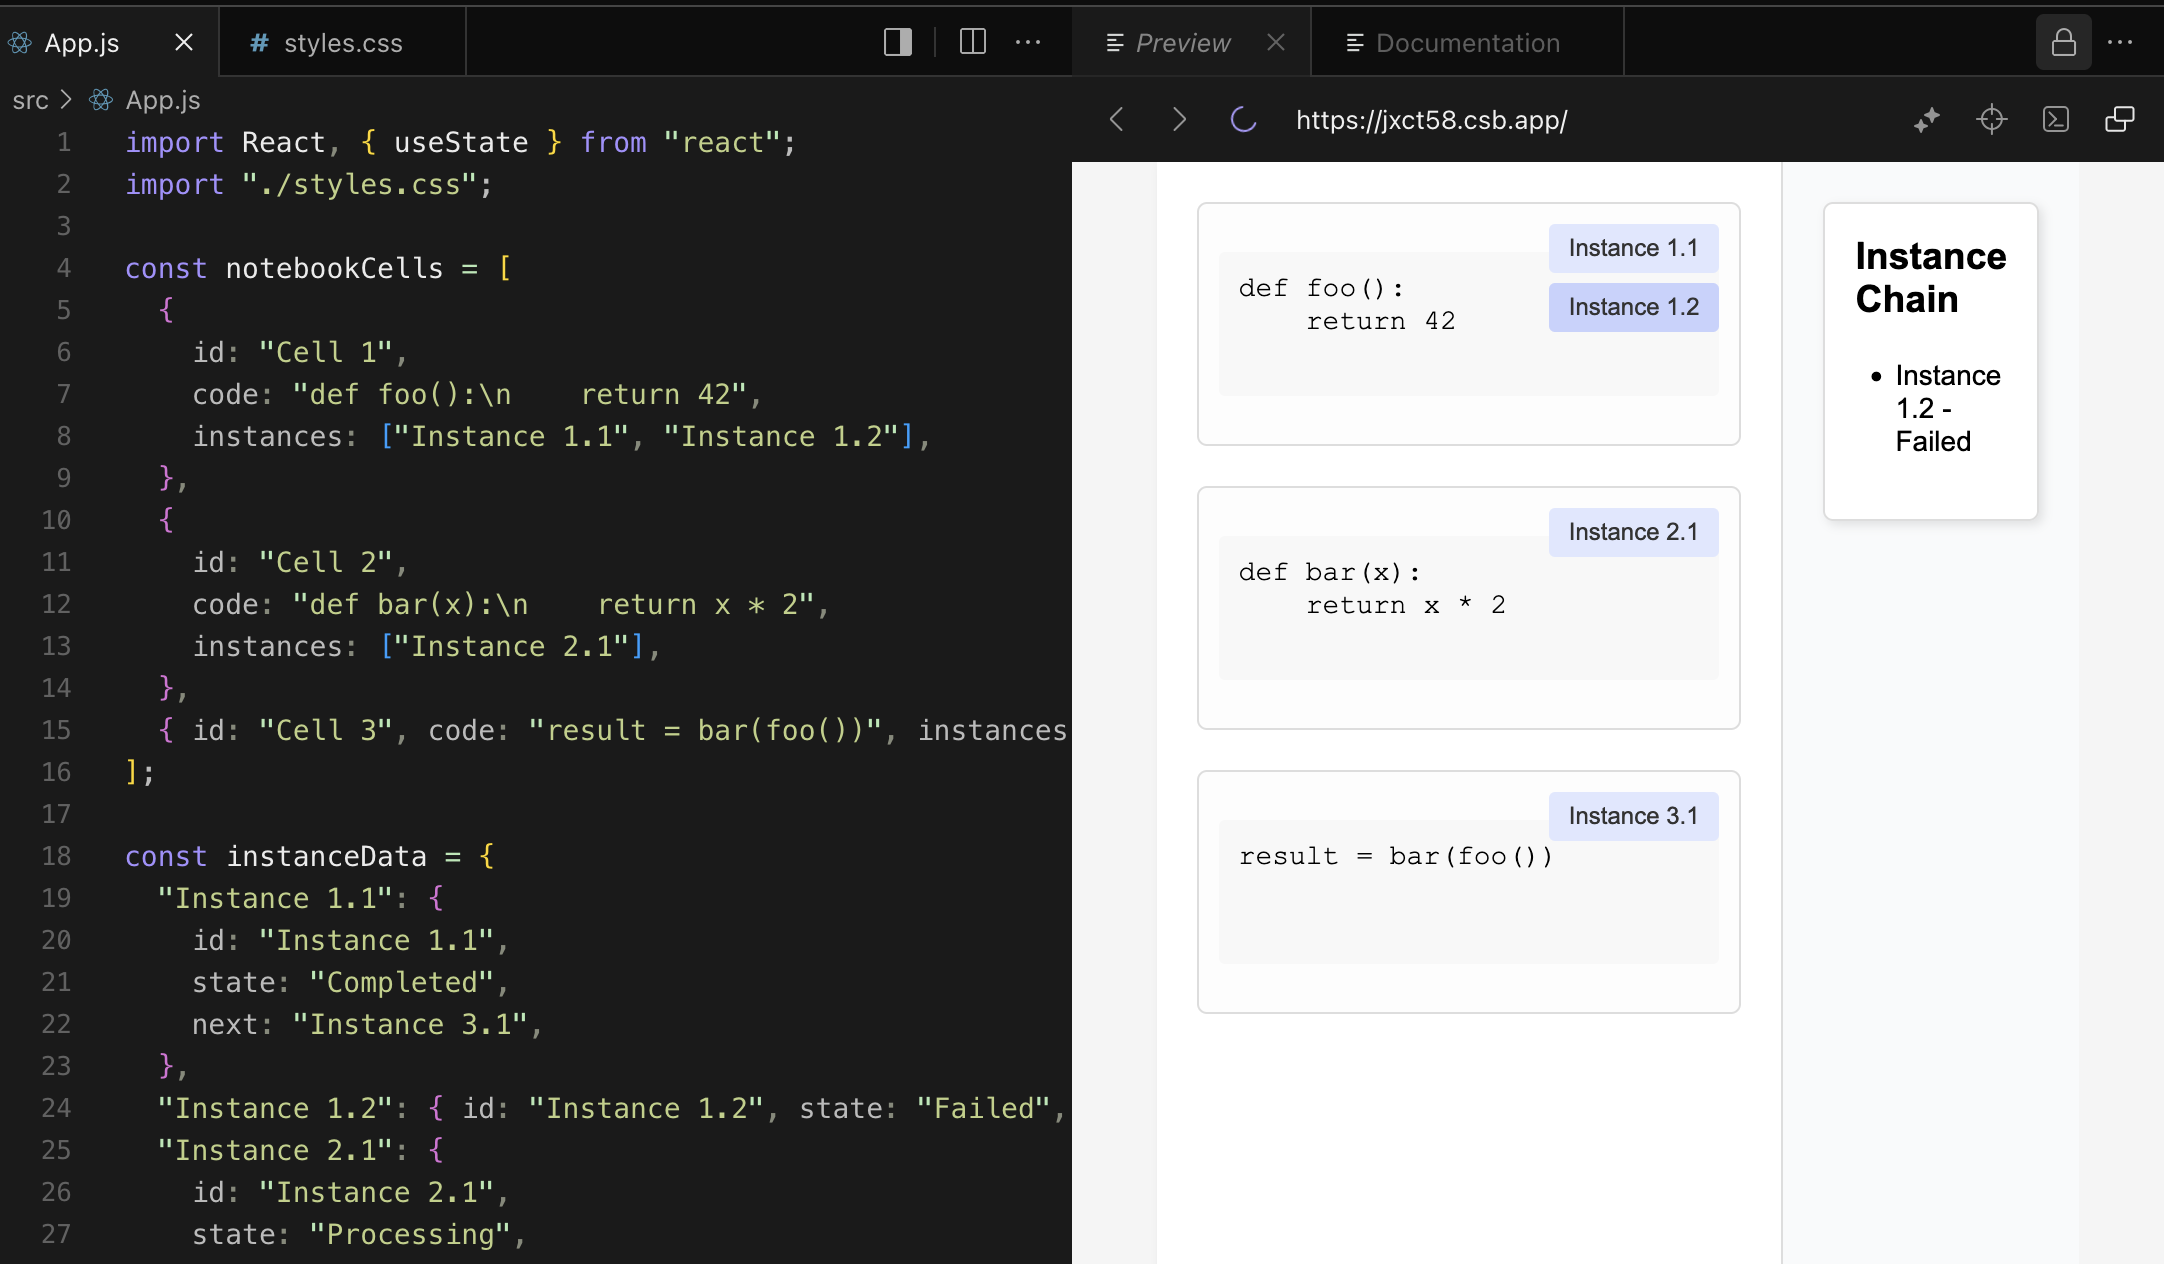
So hopefully, this is at least a way to generate many options to try out and discard without taking up much engineering time. I'll be doing this in the background as I look at some other aspects, such as incrementality. I'll cover that in the next lab note.

